Table of Contents
Ex-6: Automation of a variable geometry heat sink
🧰The Rhino and Grasshopper files used in this example can be downloaded here: variable_heat_sink.zip
- This example demonstrates how to set up an automated workflow for simulating heat transfer of a heat sink with varying numbers of fins. A video showcasing this example is provided along with key steps for setting this scenario up.
- New users are advised to check out the getting started page to understand the basics of using the plugin.
Video Demonstration
Geometry Setup
The geometry consists of 2 main components.
- A curve profile/surface that is revolved around the z-axis by 360 degrees.
- A rectangular fin geometry that is arranged via a polar array component to create “N” number of fins attached to the core.
These geometries are then merged to create a single part for the heat sink.
Simulation Setup
Thermal Loads
- For the component block, the geometry from the previous setup is used along with a standard thermal material block with “Aluminum 6061” selected.
- Next convection boundary condition and flux boundary condition components are used for the simulation's boundary conditions.
- The heat sink geometry is input for the convection boundary condition component along with a heat transfer coefficient of 39 W/m^2-K and an environment temperature of 293 K.
- A small square surface is used for the flux boundary condition with a total input of 257 W or 642500 W/m^2 directly to the BC component in this case.
Simulation Settings
- A resolution of 100,000 is used.
- Direct solver is left as “True”.
- A default basis order of 1 is used.
- Importantly, the solver mode on the thermal solver component is set to “True” once everything is set up properly to begin automatically solving different geometry variations for comparison. Until everything is set up correctly this should be left as “False”.
- When this solver mode is set to “True” it will solve automatically if anything upstream to the solver component is changed, else the “solve” button will need to be clicked.
Post-Processing
Visualization
- Create a visualization block and connect the solver output to the visualization block
- Optionally, users can connect the visualization settings block for customizing the views
- Right-click on the visualize block and choose the simulation output for display (e.g. temperature or heat flux).
Using Automation
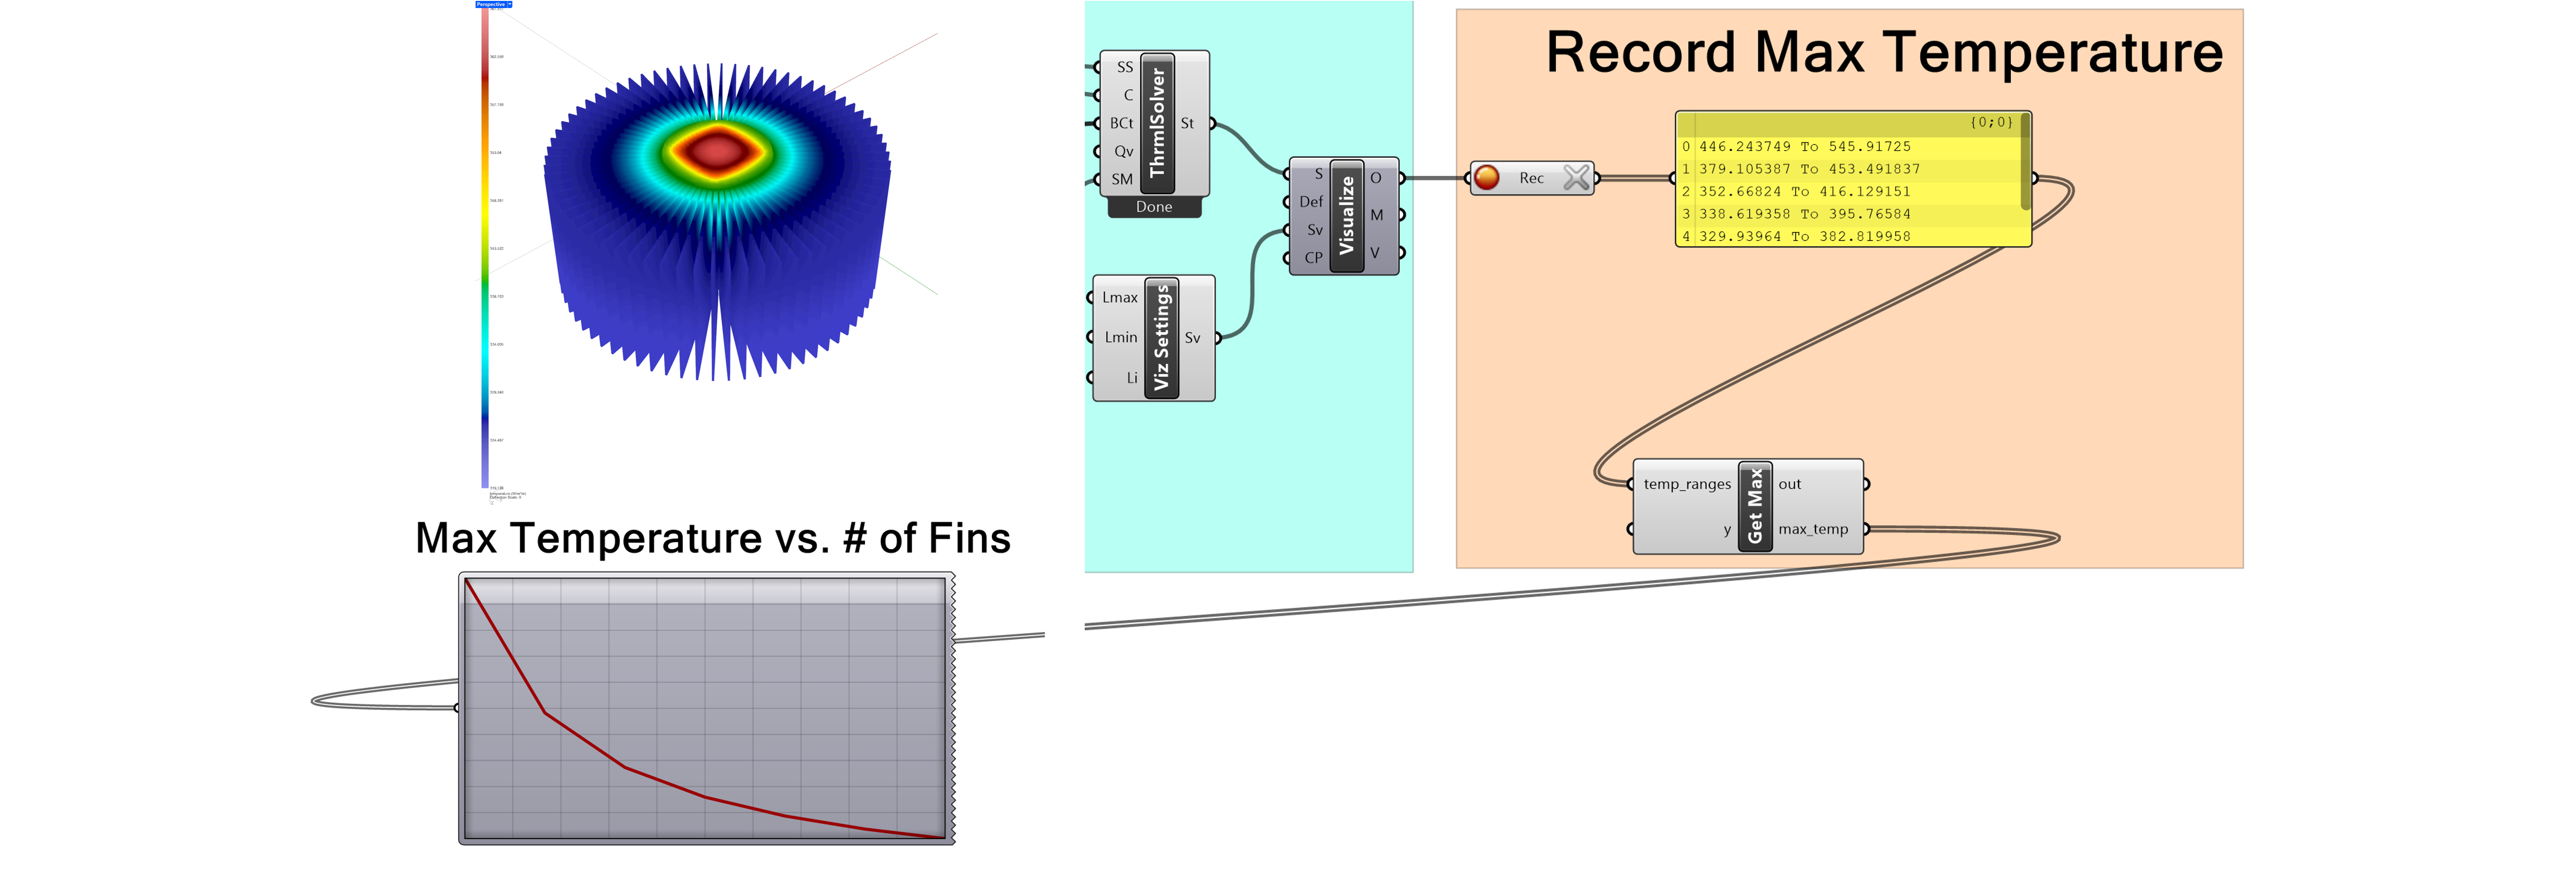
One way of utilizing this automated simulation workflow in Grasshopper is by connecting the output of the visualization block to a “Data Recorder” component. This will store the “{min} to {max}” values for each different simulation for the selected quantity such as temperature. Now, the geometry drop-down can be changed to increase the number of fins and seamlessly simulate the new geometry to calculate and record the temperatures. Lastly, the max temperature can be extracted with a custom python script and plotted for each new simulation with a “Quick Graph”.
The temperature distribution of the heat sink is displayed below, which shows that the max-min temperature is approximately 367 K and 319 K respectively for the 70 fin geometry. The maximum temperature for # of fins ranging from 10 to 70 with a step size of 10 is also displayed as a plot.


