Results and Visualization
Visualize
All Results can be viewed using the Visualize Block.
The visualization block accepts the following three inputs:
- the simulation to be viewed as the output from a solver block or loaded from a previous simulation
- deflection scale
📌See Visualization Hints for how to hide geometries that are interefeing with visualization and how to get scaled deflection
Simulation Reader
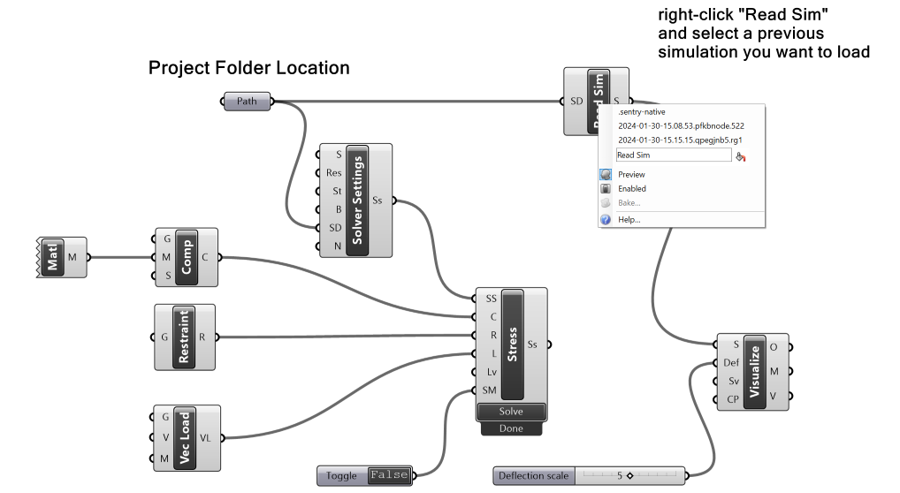
A Simulation Reader block can load the results of an existing simulation for visualization. It can accept an optional input to specify where solutions are stored. Right-click on the block and select a simulation.
Figure below has a simple example that show how to use Read Sim block to visualize old simulations from a Project folder.
Visualization Settings
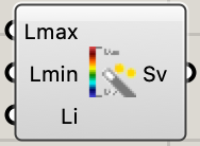
A Visualization Settings block allows configuring the display of the visualization.
The inputs are the maximum and minimum fraction of the full scale of the quantity you want to visualize, and an index indicating a different legend color scale to use. The defaults are to visualize the full range of the quantity of interest, and the default color scale is a rainbow color scale.
For example, to visualize the middle 50% of range of the quantity of interest, set Lmin to 0.25 and Lmax to 0.75.
Solution Sampler
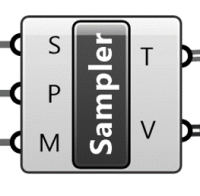
The sampler block samples a solution at a set of points. It has 3 inputs:
- the solution to be sampled
- list of points in (or on) the geometry where the solution is sampled
- a material input in the case of an assembly of components with different materials.
Note that using incorrect material will yield wrong results.
. The outputs are as follows:
- a list of the names of the solution quantities
- a tree of solution values at the input points
- a list of the corresponding points where the sampling occurred (these points may or may not correspond identically with the input points)
📌 See an example problem: Sampling Custom Points
Visualization Hints
Note: you may have to hide other geometries that interfere with the result visualization ( Z-fighting ) and also use Wireframe mode. Other geometries may have been added through Grasshopper (hide by turning off Preview for the GH block) or through Rhino (using Rhino's Hide command)
Usage of deflection scale to animate the part deflection.
- Scale the deformation to see the deflected shape
Previews In the same vein, the inputs to the simulation (components, loads, and restraints) can have their previews turned off to avoid their geometry interfering with the visualization of results.
Interpreting Stress Simulation Results
Given geometry, material, restraints, and loads, Intact.Simulation for Grasshopper computes several types of quantities that are useful in understanding predicted structural properties of the model:
- Displacements. The primary computed property is displacement – a vector (x-, y-, z-) quantity measuring where each point of the body moves after the loads are applied. The total displacement is a (scalar) magnitude of the displacement vector. Displacement is measured in units of length. Displacements are important for a number of reasons:
- Recall that Linear Static Analysis is really a “small displacement theory” that assumes that the solid shape does not change very much. Thus, the computed displacements can be interpreted as a first approximation of the actual deformation indicating tendency and magnitude of deformation. They can be magnified and visualized in the deflected view. But if the computed displacements are large, the actual deformation may be very different.
- Generally speaking, predicted values of displacement are always more accurate than predicted values of strains and stresses, because displacement is the primary quantity directly computed by solving a system of linear equations. In contrast to stresses, displacements have finite magnitude and do not have singularities at any points.
- Large displacements are not necessarily bad; they simply indicate flexibility of the system to move or deform.
- Because displacement is the primary computed quantity, its accuracy is necessary for accurate prediction of all other properties. In particular, all computation of stresses, strains, and failure criteria require accurate displacements.
- For the same reason, displacements provide the best measure for comparing consistency, accuracy, and convergence of computations – in the same system or between different systems.
- Strains. Informally, strains measure (directional) rate of deformation within the body. It is dimensionless because it measures change of length per unit length. Just like stress, one-dimensional strain can be measured in any direction, and there is one-to-one correspondence between components of stress and strain (normal, shear, principal, etc.).
- At every point in the body, it is possible to orient the coordinate system in such a way that only normal strains acting in the three orthogonal coordinate axis directions remain. These three components of strain are called principal strains. The value and the direction of the principal strains changes at every point.
- Generally, strains are proportional to stresses (i.e. large strains imply large stresses), and in linear elasticity stresses and strains are directly related by proportionality constants according to Hooke's law. Strains may be also used directly to predict material failures.
- Stresses. Stress describes all forces acting at a point in a body. Different forces act in different directions. For any selected direction, stress in that direction is measured in units of Force/Area as a force acting across an imaginary plane perpendicular to the selected direction.
- At every point in the body, it is possible to orient the coordinate system in such a way that only normal stresses acting in the three orthogonal coordinate axis directions remain. These three components of stress are called principal stresses. The value and the direction of the principal stresses changes at every point.
- Principal stresses are the main tools in predicting failure of materials based on properties of materials and postulated theory. Von Mises criterion is popular for ductile materials, while Rankine and Mohr criteria are widely used for brittle materials.
- Stresses tend to vary much faster than displacements and may even grow unbounded in the vicinity of stress concentrations – in agreement with the theory of linear elasticity.
- Danger Level. For a specific failure criterion, a danger level is a scalar value that ranges between 0 and 1. It is computed at every point as a ratio of the computed value of the selected failure criterion to the threshold value known to cause failure of the particular material. A value greater than 1, indicates that the computed value exceeds the known threshold.


